
Brief description of the current demographic situation in relation to the aging population, migrations, “brain drain” and the other (demographic) indicators influencing the situation on the regional / national labor market
The issue of age management is gaining in importance, both on the social and macro and microeconomic level. We are witnessing a systematic increase in the number of older workers while decreasing inflow of young talent and difficulties in cooperation between the representatives of the above groups. Very sharp decline in the population of pre working groups calls into question the problem of generation replacement in the coming years.
Analysis of demographic and economic indicators shows what a huge challenge for the Opole province is the problem of depopulation resulting from the intersection of two very strong and interacting trends: external migration and negative natural growth. It is the Opole region where these phenomena are felt the most.
Undeniable demographic facts will carry important social, economic and budgetary consequences. Therefore, developing of age policy is a very important issue for many regions, especially demographically aging region of Opole.
Statistical data on employment / unemployment rate in relation to the age structure
Analyzing the age structure of employment we draw the following conclusions:
LFS data for Poland in 2014 show that:
– In the age group of 30-39 years old, 81% are employed;
– In the group of 40-49 years old – 79.9%
– And a group from 50 years old – only 30.3% are employed
This is a simple ratio on approach of the company to the customer. It is the Staff of particular departments who determine the audience of the product / service of the company. Apart from education in marketing they are the people who look at the market through the prism of their own needs and experiences, but also through the stereotypical perception of reality. Thus, if the dominant group of employees in enterprises are those aged 30-49 years old and there are few or no employees aged 60+, in the result, the company does not know the actual needs of seniors, and consequently – will not be searching for the ways to satisfy them by adjusting the company’s offer to the expectations of this group of customers.
Conclusions for enterprises: the topic of aging populations will affect everyone, in every area of interaction of the people. Those companies that as first ones prepare their strategies taking into account demographic changes, will have competitive advantage.
Recent data from the region show the following situation:
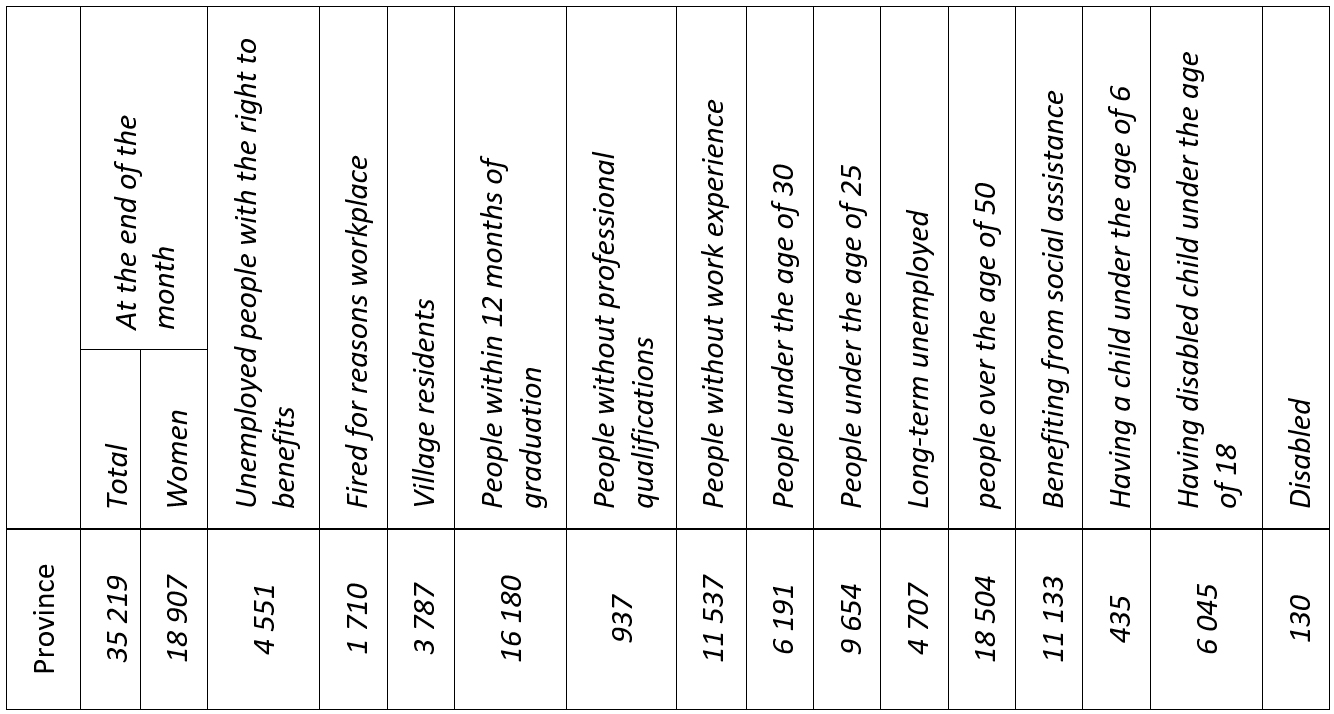
The number of unemployed in the region of Opole in April 2016 amounted to 35 219 people, and the unemployment rate stood at 9.8% (estimate VLO). Compared to March 2016, the number decreased by 1 718 people unemployed.
Tab.no.1 Selected categories of unemployed as of April 30, 2016
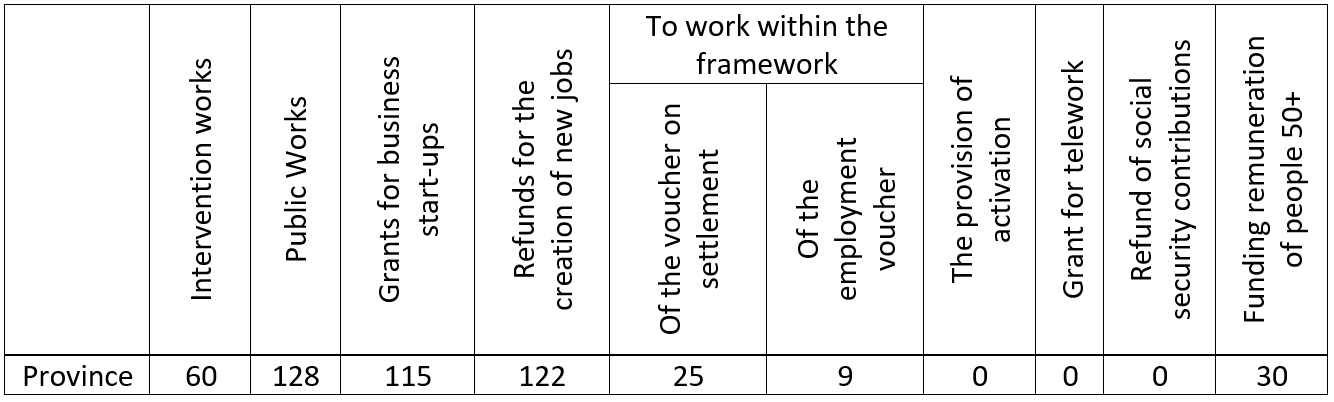
 Tab.no.2 Number of people targeted to take up employment within the active forms of support in April 2016
Tab.no.3. Number of job offers coming to Job Offices in April 2016
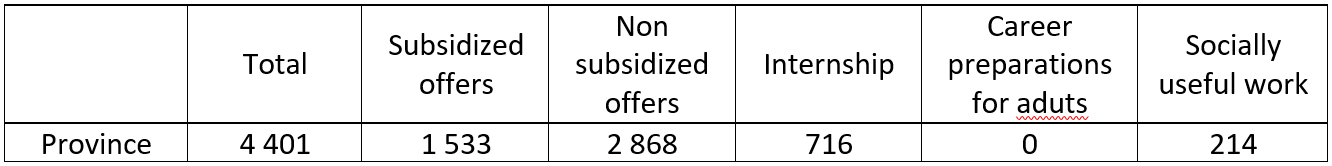
Source: http://wupopole.praca.gov.pl/-/2887509-informacja-i-sytuacja-na-rynku-pracy-w-kwietniu-2016-rok
Demographic forecasts in your country (charts in connection with the situation in 2050, etc.)
By 2060 the population in Poland will fall by at least 8 million – from the current 38.3 million to 30 million – according to data prepared by the experts of the Central Statistical Office and the Committee of Demographic Sciences of the Polish Academy of Sciences. Demographers predict that in the years 2015-2030 the number of working-age population will steadily decrease up to the level of 20.8 million in 2030. The population of working age will increase to 9.6 million. Experts are certain that in the coming years, due to the low number of births and the slight increase in the number of deaths, natural increase will definitely be negative. The decreasing fertility and increasing life expectancy will result in the rapid aging of the population. The average life expectancy in 2030 will reach 77.6 years for men and 80 years for women. In the coming years it will be a further decline in fertility of Polish women, with about 1.22 children per woman to about 1.1. In order to bring to the replacement of generations, it should fall 2.1 children per one mother. The number of births will drop to the level of 315.5 thousand in 2020 and 232.7 thousand in 2030. In terms of fertility Poland now ranks 214 among 224 countries in the world.
Demographic forecasts for the years 2015-2030 predict that number of young people aged 16 to 24 years in 2015 will systematically decrease from the current 6 million to about 4 million and 3,000,000 in 2030. There will also be further change the ratio between the number of Poles of working and pro working age. It is expected that by 2030 the average age of a Polish citizen will increase to more than 45 years (currently it is around 37 years old), with a tendency for further growth. In the middle of the century there will be nearly 700 retirees for 1000 working people (currently it is 270 pensioners).
Due to aging population and unfavorable demographic forecasts for the Opole region there are many scientific papers, which aim is to analyze the situation of persons 50+ on the labor market and to develop instruments to improve their situation by showing to the employers the possibility of a better and more efficient usage of the older workers opportunities . With regard to research and analysis of the literature it is showed that, due to small differences in the level of competence between younger and older people in terms of competencies management, age is not an obstacle to economic and general activity of the elderly.
As part of the features, the quality of which increases with aging we can name as follows: reliability, self-esteem and skills, the ability to rationally assess the situation, level of experience and professional life, expertise, accuracy, or the ability to co-operation and conflict resolution. This is important information that will allow employers to make better use of assets of the older people, which in turn can result in long-term better preparation of entrepreneurs to progressive changes in the demographic structure of the labor market
The research carried out in the Opole region also show that there are still a lot of false stereotypes relating to the quality of work of older people.
Below there are charts showing the situation on the Polish and local market – any comment to this statistical data is redundant. Source of the presented drawings can be found at: http://stat.gov.pl/files/gfx/portalinformacyjny/pl/defaultaktualnosci/5469/1/5/1/prognoza_ludnosci_na_lata____2014_-_2050.pdf
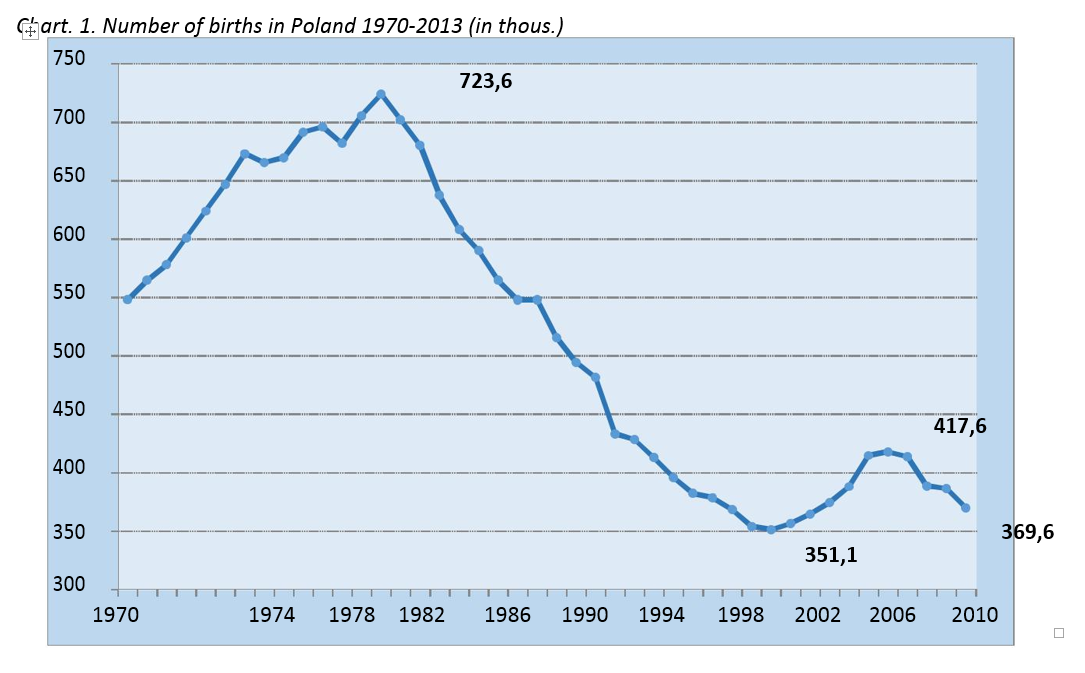
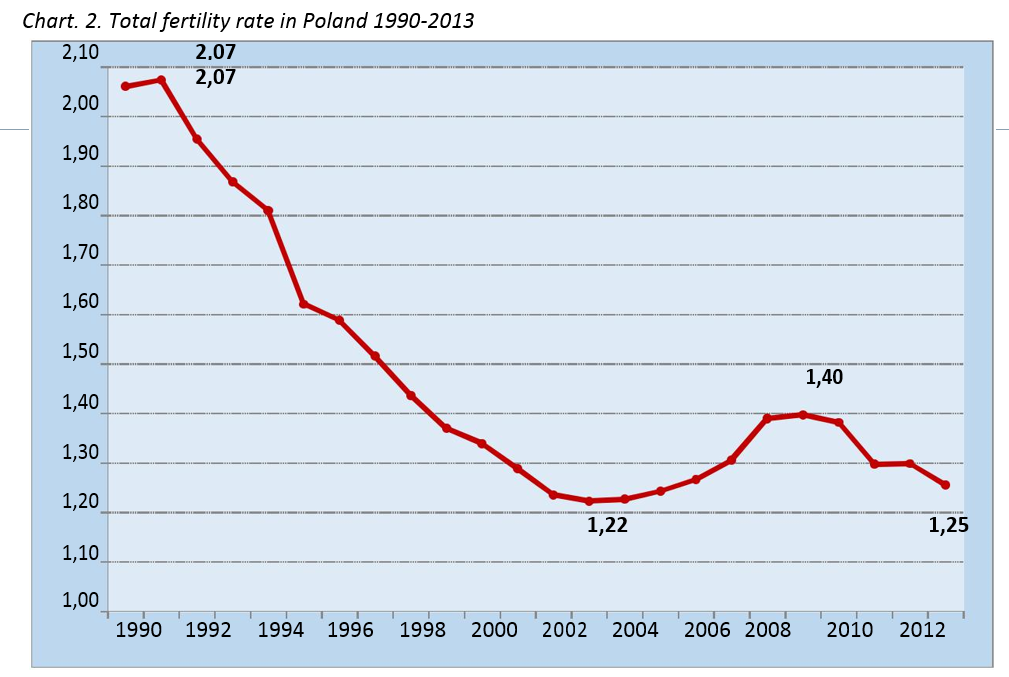
Table 2. Total fertility rates in European countries 1980-2012
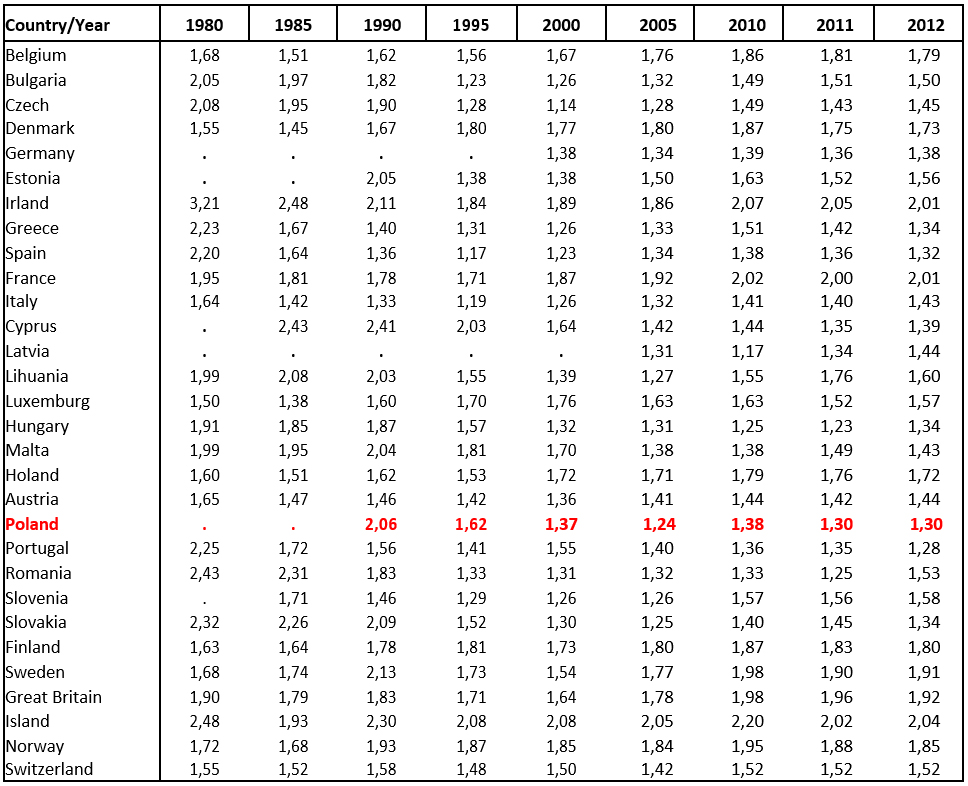
Source: data Eurostat
- 13. Total fertility rate in Poland 2000-2013 and projected for 2014-2070 according to four variants
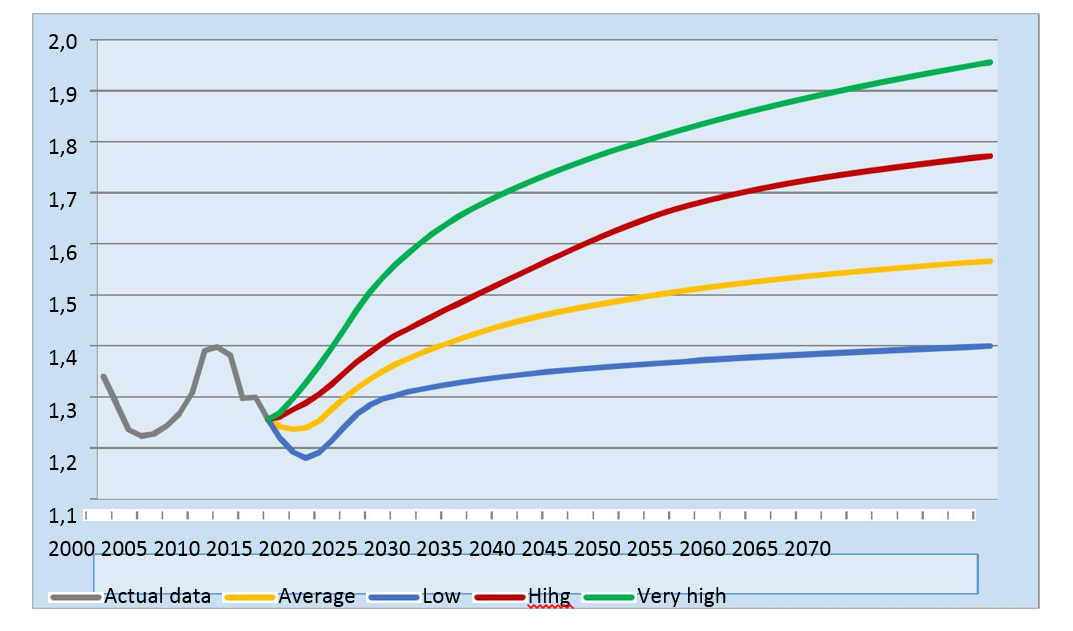 Table 4. Projected total fertility rate for Poland 2014-2070 according to four variants
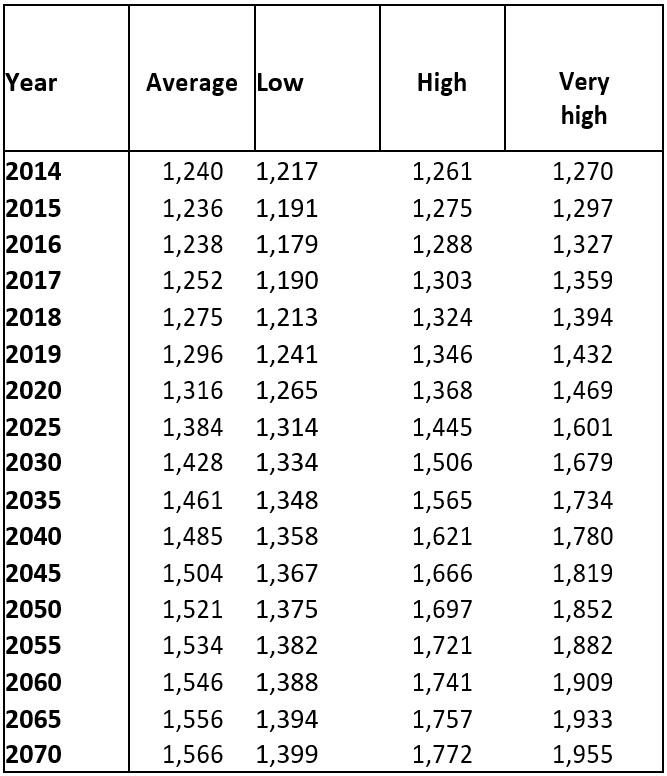 Chart. 25. Probabilities of dying in Poland in 2013 and projection for 2050
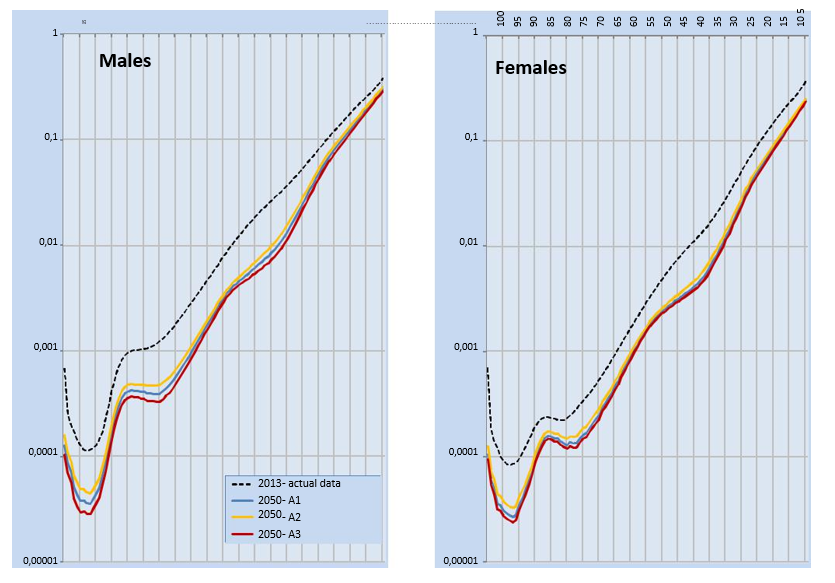
Chart. 26. Life expectancy in Poland 1960-2013 and projection for 2014-2050
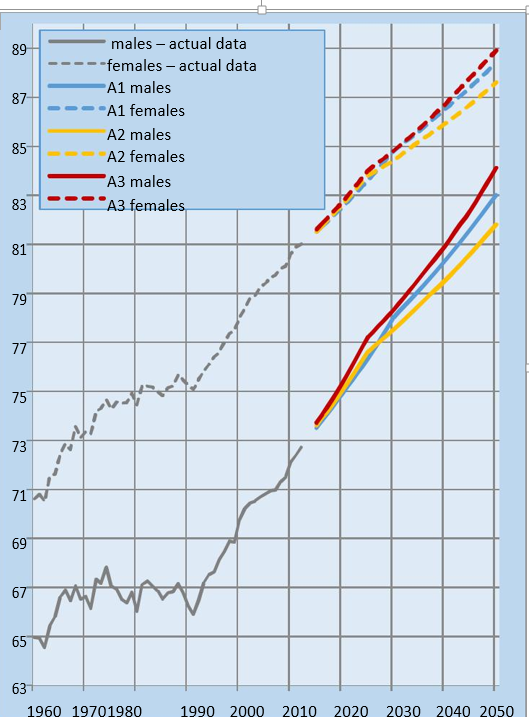
Chart. 44. Net internal migration for urban and rural areas in 2014-2035 (in thous.) projection, variant 3
Chart. 51. Natural increase by voivodships in 2013 and 2050 (in thous.)
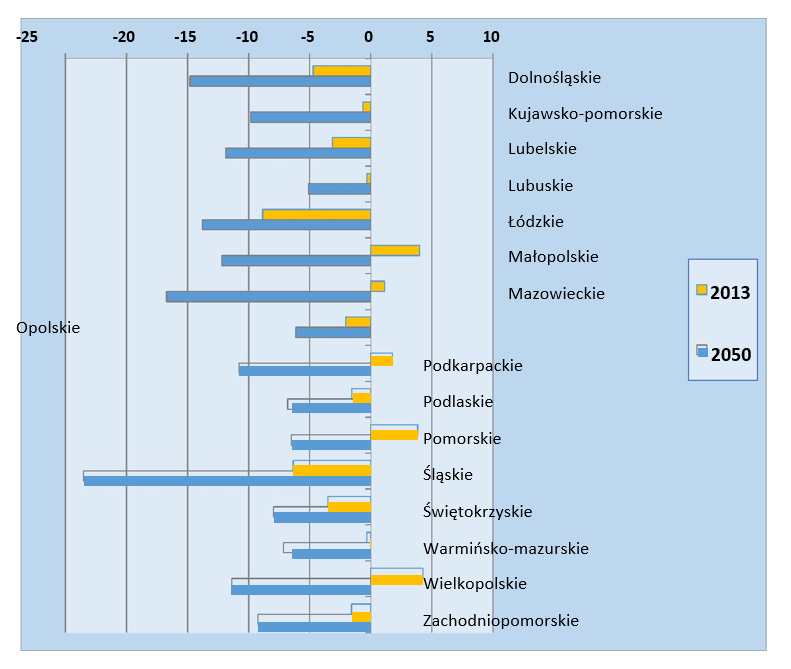
Chart. 52. Projected number a of births (in thous.)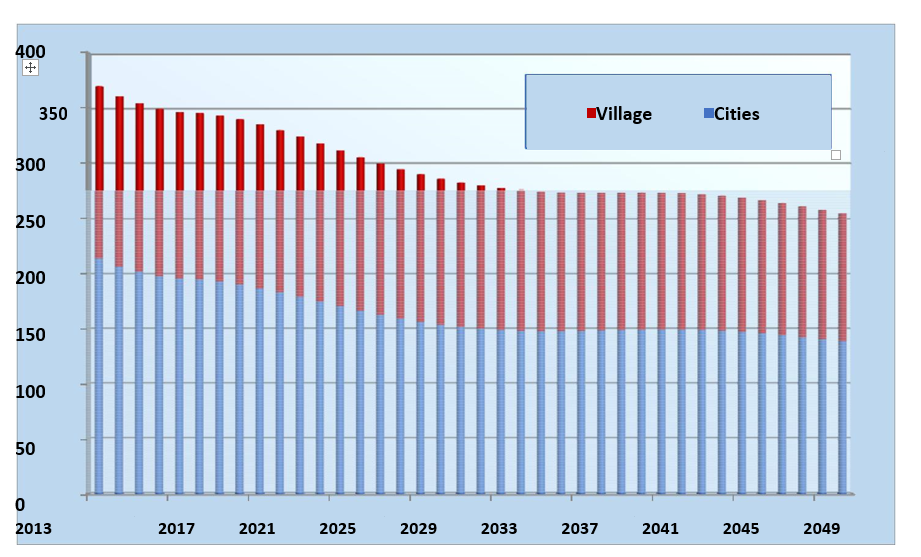
a 2013 r.– actual data
Chart. 53. Total fertility rate by voivodships in 2013a and 2050
Cities
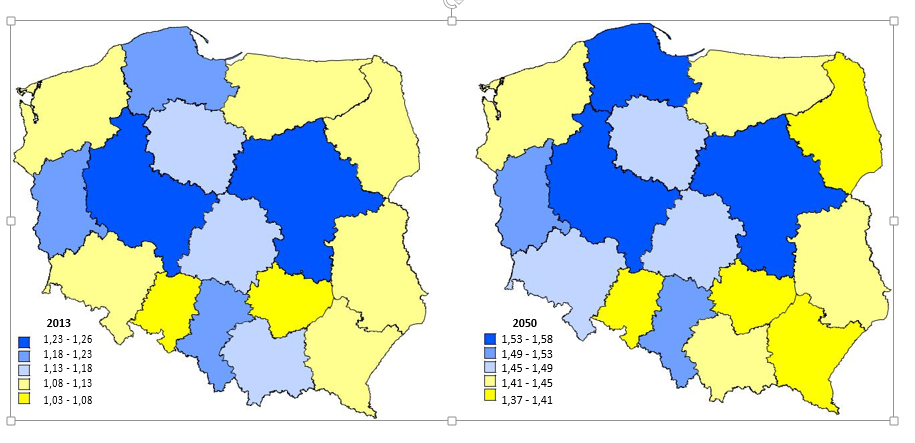 Table 21. Median age of populationa
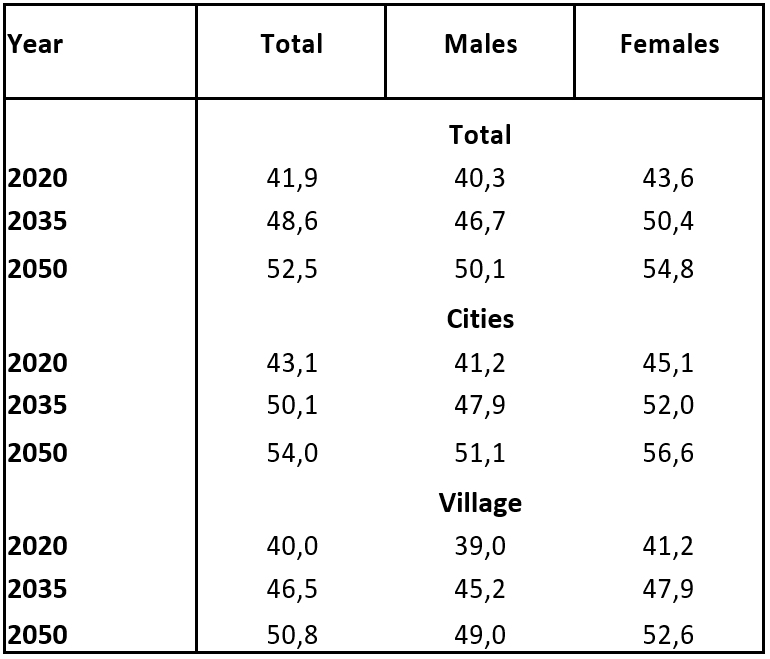
a; actual data
Table 22. Changes in of population size by biological age groups in 2013-2050 (in thous.)
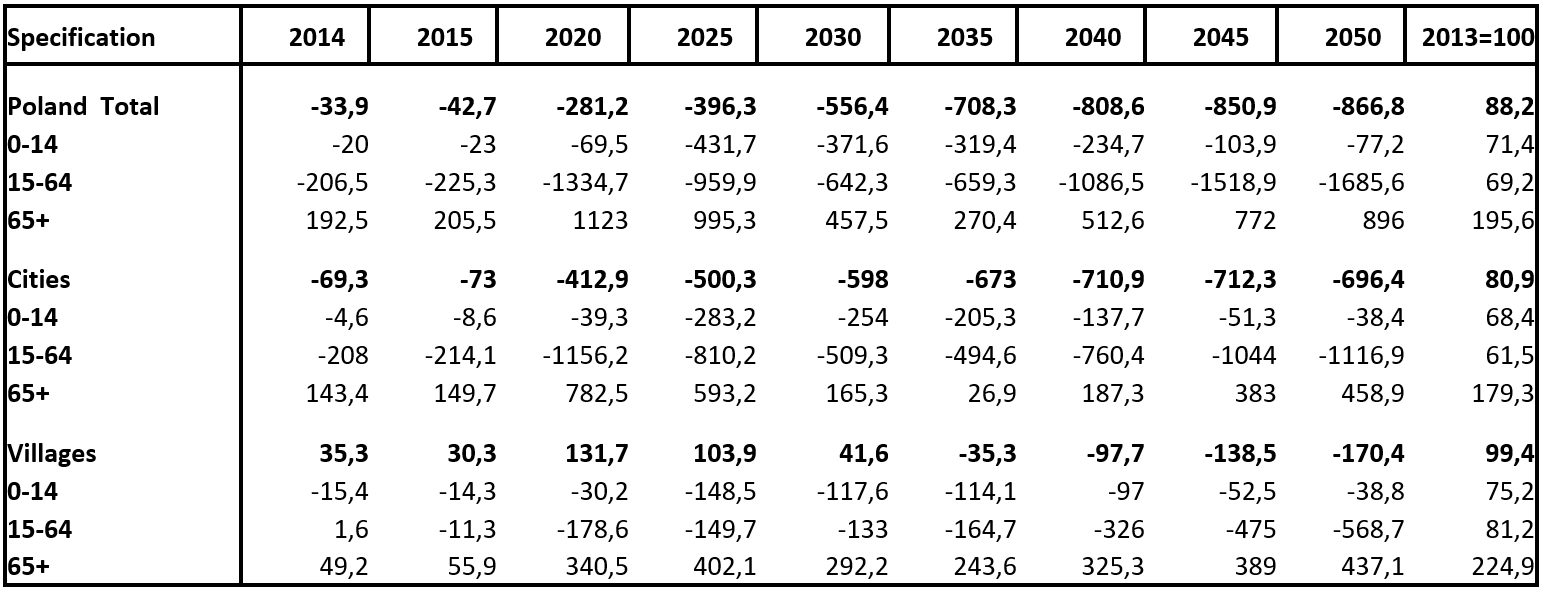
Table 30. Population on projection by economic age group according to changes in retirement age (in thous.)
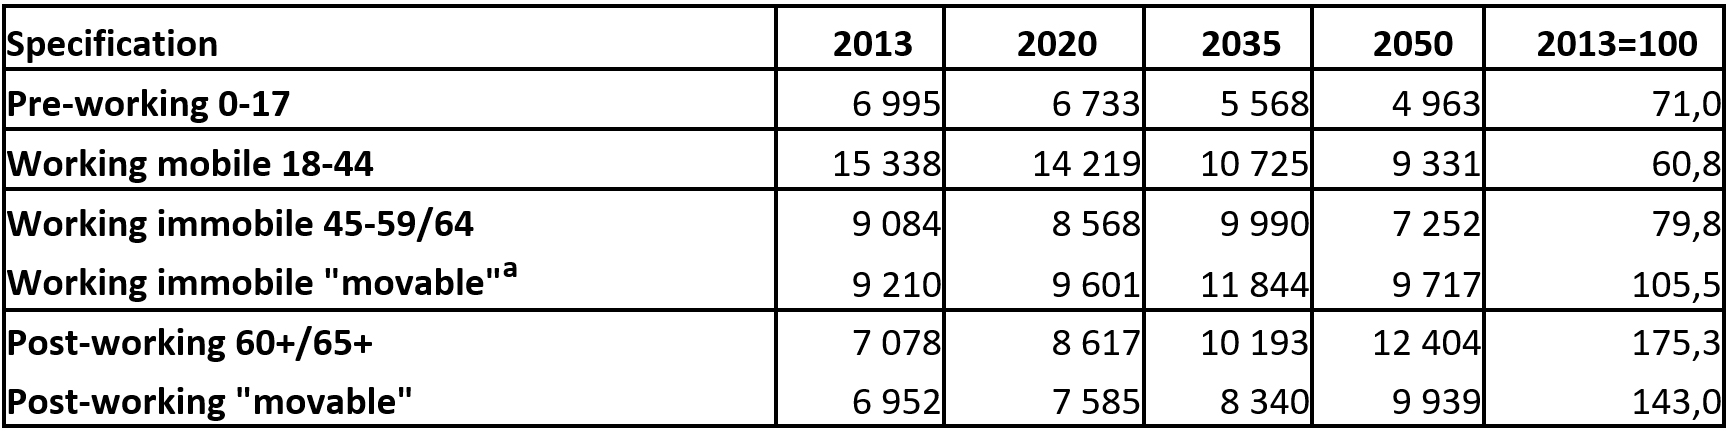
a The term “movable” refers to changes in 2040, the retirement age, hence the boundaries of age ranges in age classification immobile and post-production are not permanentOkreślenie „movable” odnosi się do zmieniającego
Table 31. Dependency ratios 2013-2050
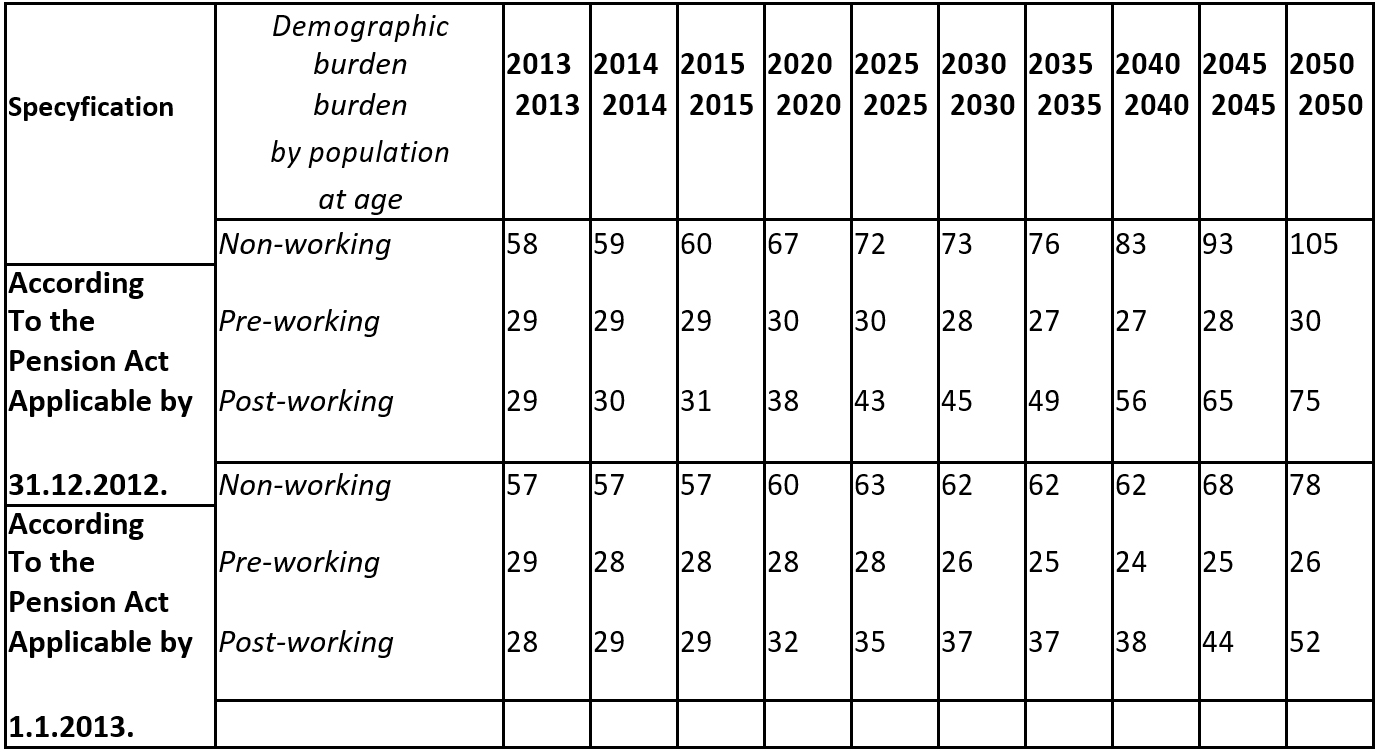
Chart. 63. Population by economic age groups in chosen years (in millions)
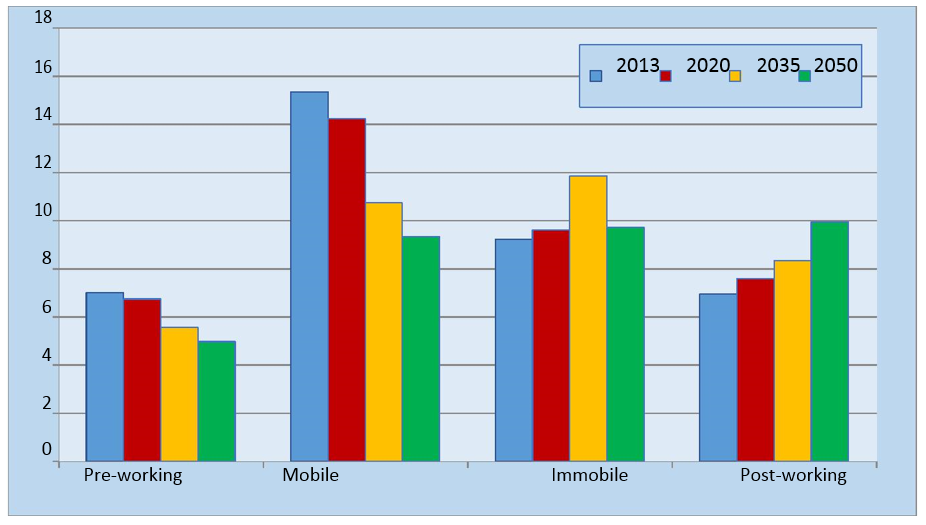
Chart. 64. Changes of structure of population by educational age groups (population aged 0-24=100)
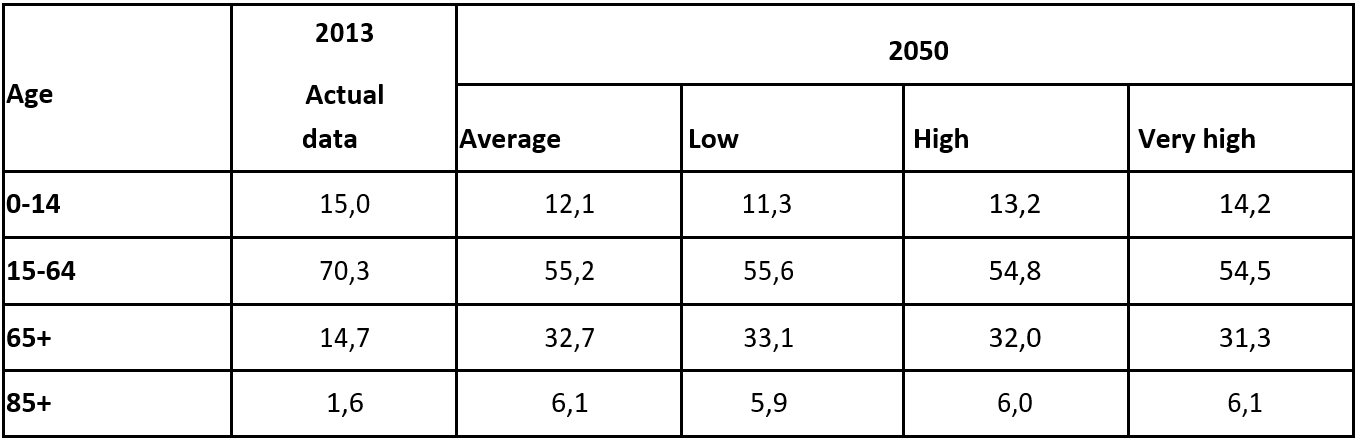
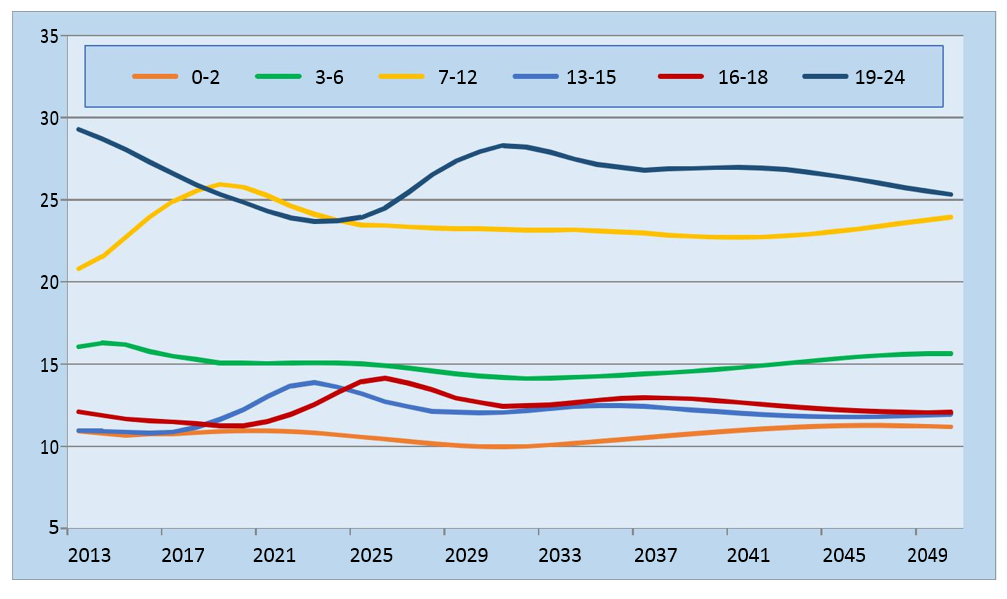 Table 39. Structure of population according to age groups in 2013 and 2050 (in %)
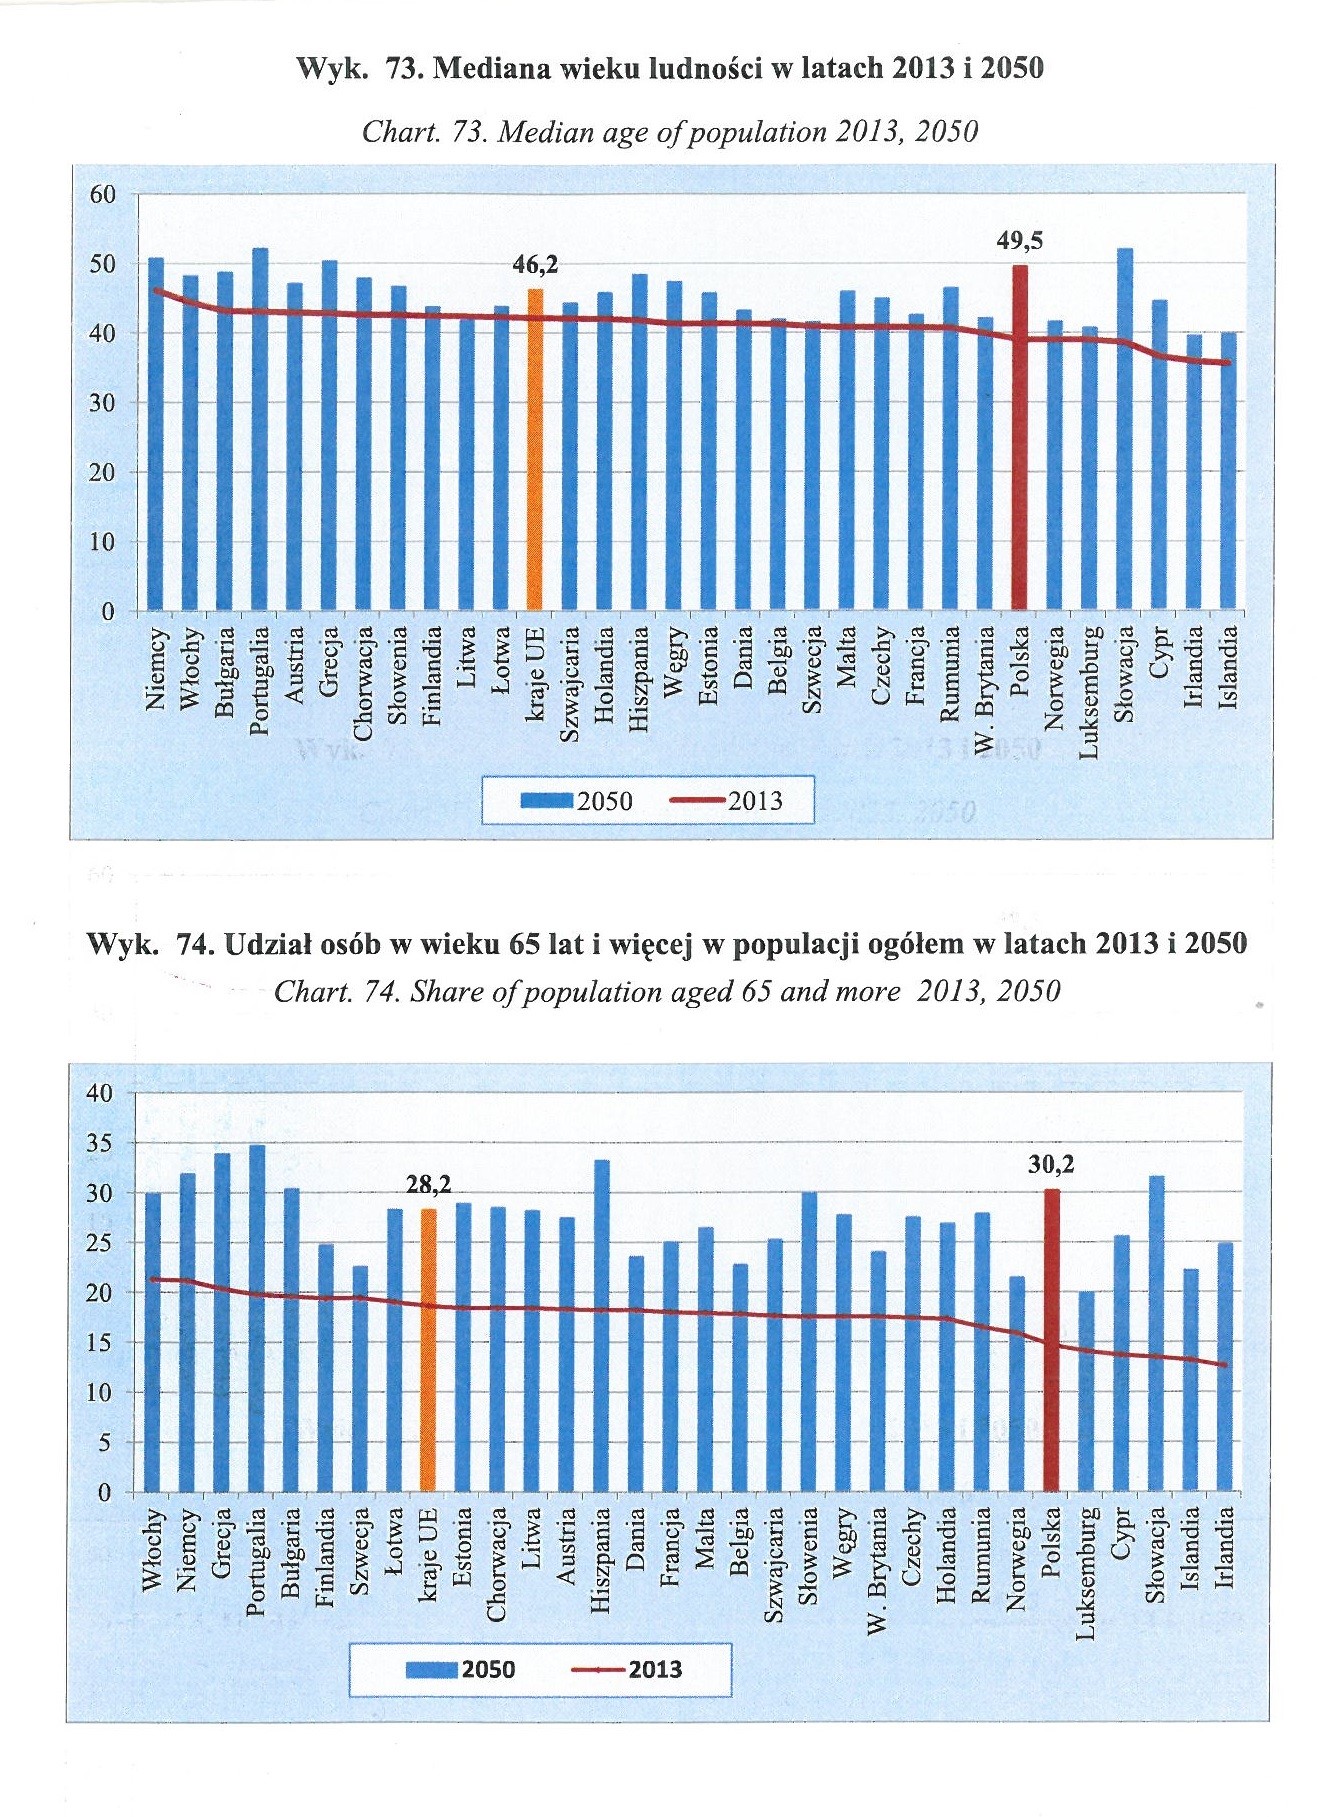
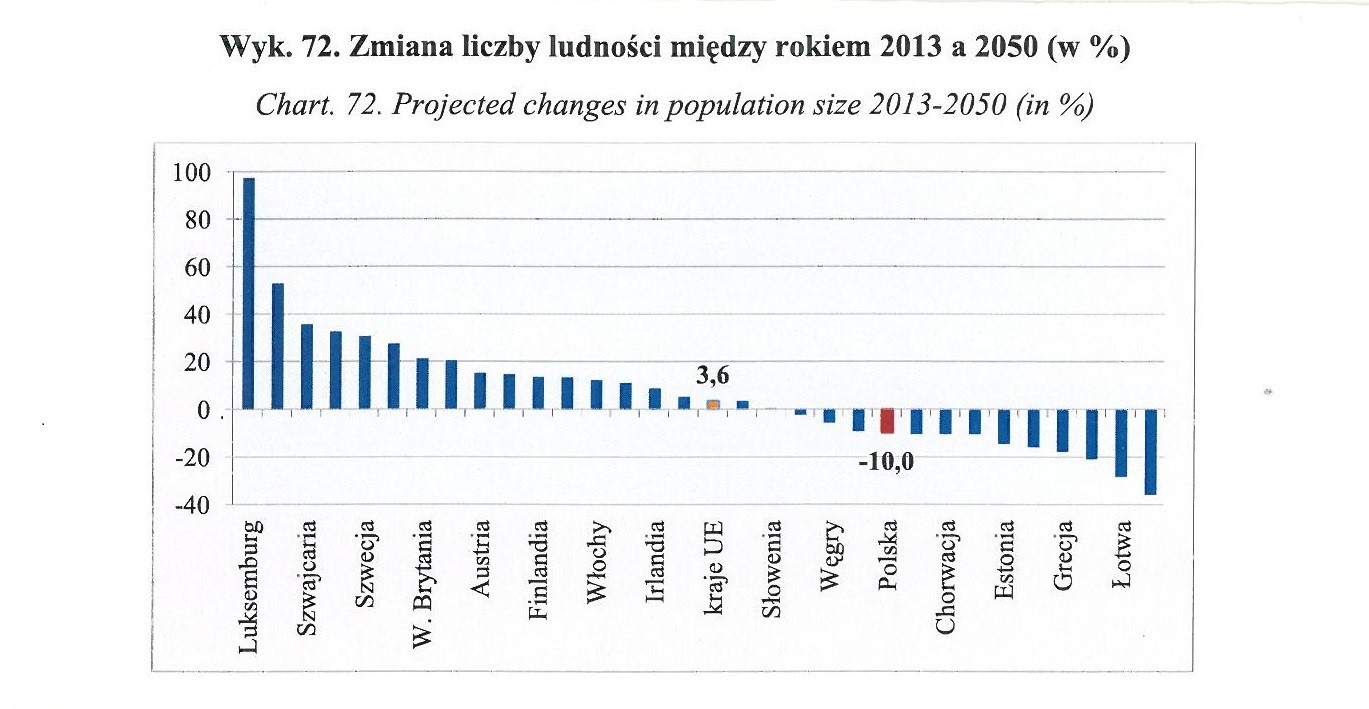
In conclusion:
Analyzing these charts it can be concluded that the fertility rate in Poland for the next few years will continue to be at around the current level (in 2013 it amounted to 1.26), but from 2018 on it will begin to increase to around 1.52 in 2050. Therefore, the level of reproduction of the population will still be far from simple replacement of generations. In contrast, the mortality rate will be decreasing, and thus the average life expectancy will extend. It is assumed that in 2050 men will live by approx. 9 years longer than at present, while women approx. 6 years longer.
The effect of the assumed changes will be drastic. In Poland there will be a gradual decrease in the population to about 34 million in 2050. Compared with the initial forecasts of the year (2013) there will be approx. 4.5 million Poles less !!!